Stroke Prediction Analysis with Python

• Analyze & Identify the factors that influence the possibility of having strokes
• Tools: Google Colab (Python libraries: pandas, scipy, seaborn, and matplotlib), Tableau & Power Point
LA Metro Bike Share
Dashboards

• Exploration Dashboard: explored KPIs and trends of rental activities from 2016-2021.
• Before and During Pandemic: visualized and compared rental activities before and during Pandemic.
• Tools: Tableau (exploration & visualization)
Fuel Efficiency
Statistical Analysis

• Performed statistical analysis to identify significant KPI that impact fuel economy
• Tools: Microsoft Excel (Pivot Table, Pivot Chart, Statistical Analysis, Data visualization) & PowerPoint
Lariat Profitable
Excel Model & Dashboard
• Build Excel models and dashboards to maximize revenue while minizing cost
• Tools: Microsoft Excel (Pivot Table, Pivot Chart, Dashboard, Model building) & PowerPoint
Superstore
Analytic Dashboard
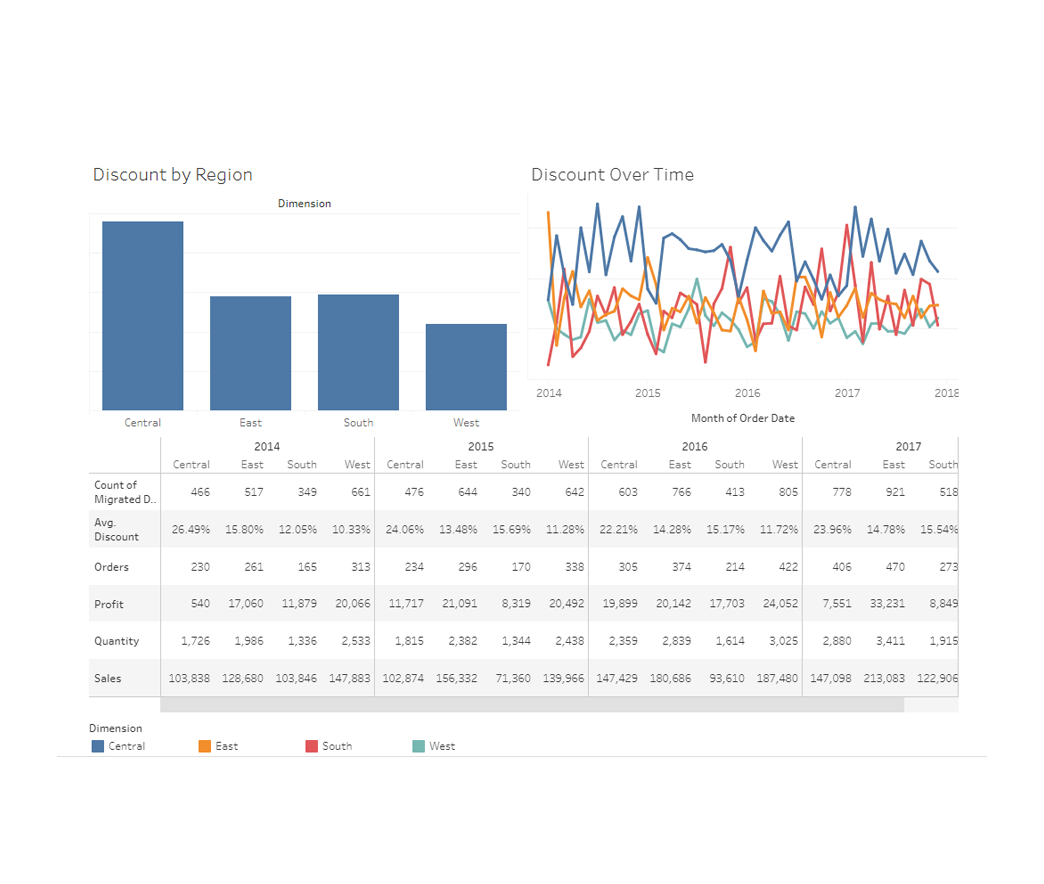
• Examined sales data of superstore and performed data visualization
• Tools: Tableau